Introduction to STATISTICS #
UPONSCALE provides numerous statistics, at the level of the nodes, the virtual machines but also concerning the management machine itself.
The statistics are available on the dashboard, in the dedicated statistics menu, but also in the cluster menu, in each virtual machine and so on…
TIPS #
TIp : Zoom In #
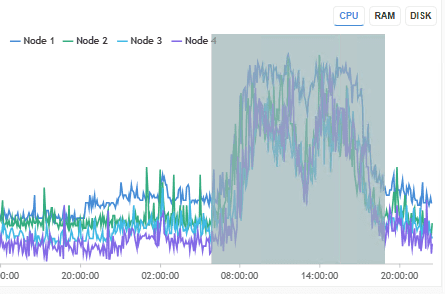
In each statistics screen you can zoom in by selecting the time frame !
Zoom In by selecting the time range :

You now have more precise data
TIp : Zoom ACTIONS #
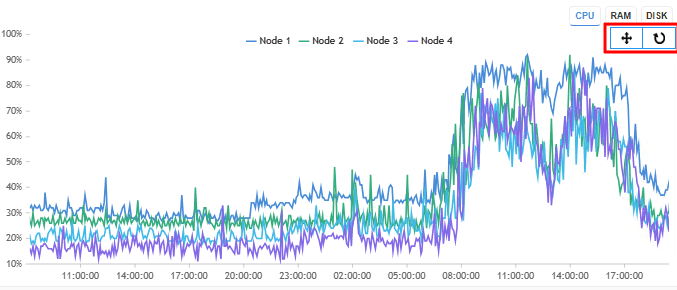
Two action are possible when you selected you time slot
Some actions are available since you selected a time slot:
– Use Reset button
Cancel the selected zoom and go back to default view
– Use Pan Mode :
You can now defil the screen to have access to newest or older stats

TIp : ZOOM FILTERS #
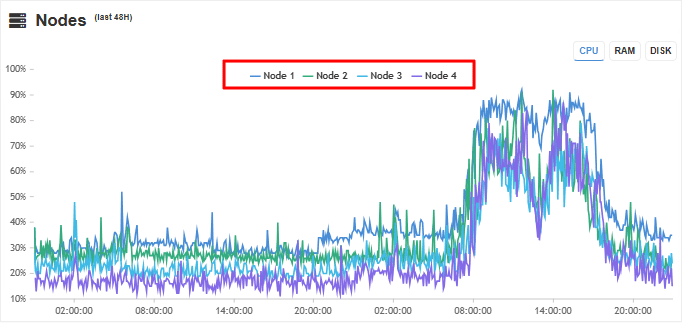
Simply click on a node to filter the data displayed
Il is also possible to select the data displayed for better comparison
– To filter nodes, click on one node you want to unselect:


